How is my recent average changing?
A moving average combines recent readings into a value that updates as new readings arrive. It softens daily ups and downs, but can still fluctuate as readings enter and leave the calculation.
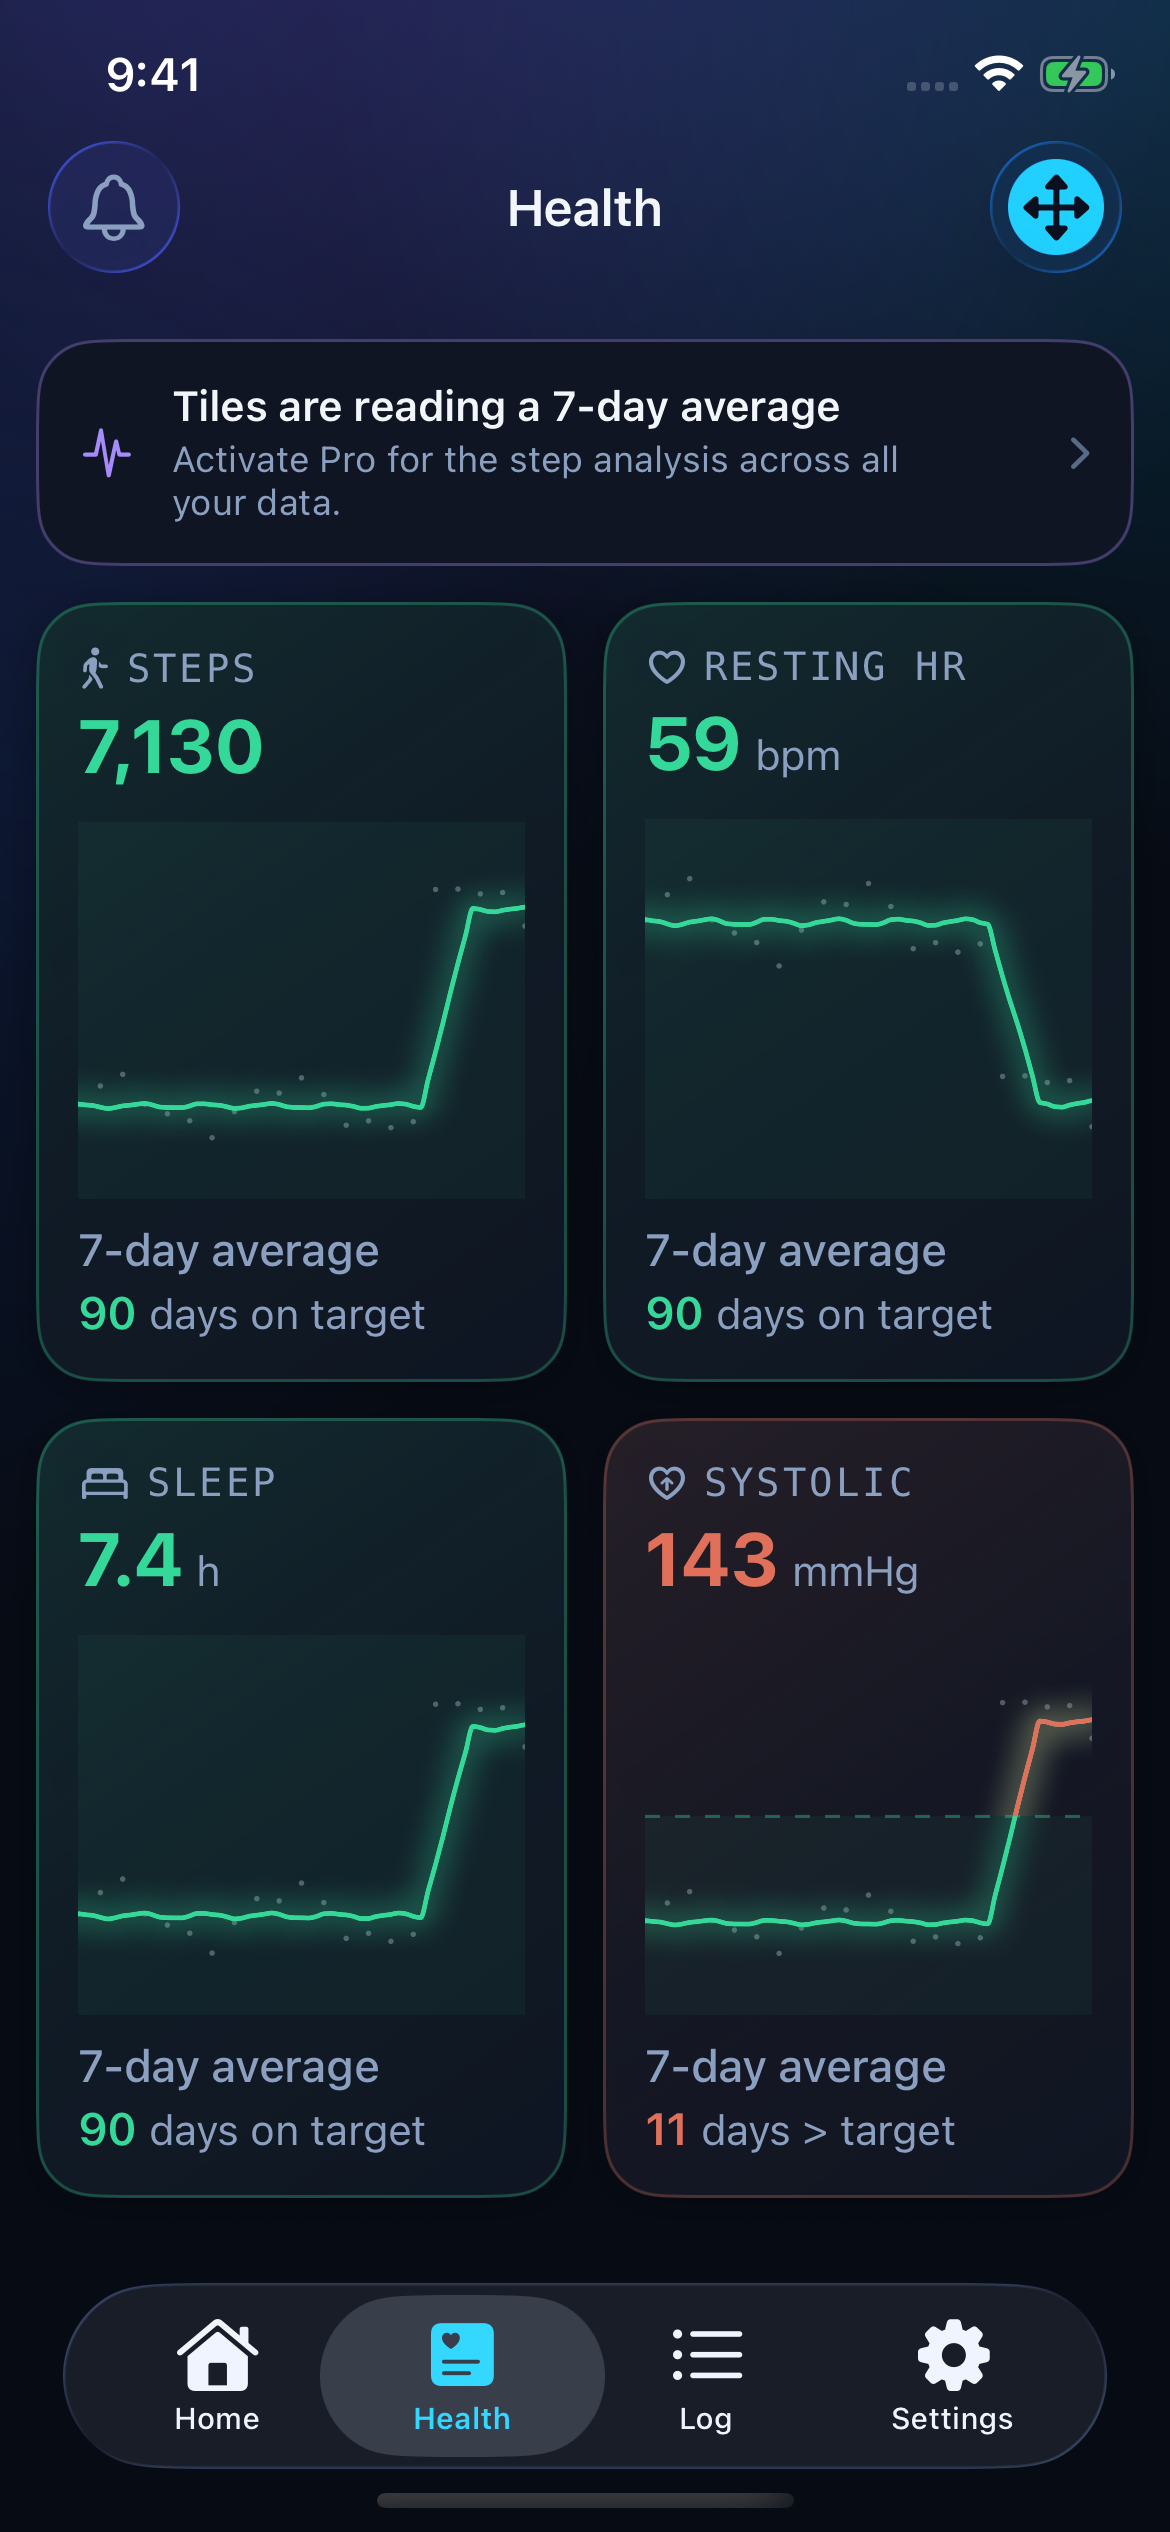
A feedback loop you can see: record a weigh-in, understand the direction, decide whether to adjust, then check back. Here is how to read the app.
Actual app screenshots with illustrative sample data.
Each point is a weigh-in. The blue line follows the direction through a stretch of readings. When the app detects a different direction, a new section can begin.
The scale says 97.5 kg, while the trend says 97.0 kg and is heading down. The readings bounce around the line, but a higher point has not overturned the downward pattern.
That gives you a reason to look beyond today’s number. Is the trend still heading towards your goal? You may have reason to stay the course.
The green projection extends the current trend. Here, it estimates 96.1 kg in seven days and a goal date of 15 October. New weigh-ins can move those estimates. The milestones below break the journey into smaller steps.
A forecast is a possibility based on the current trend, not a deadline or a promised result.
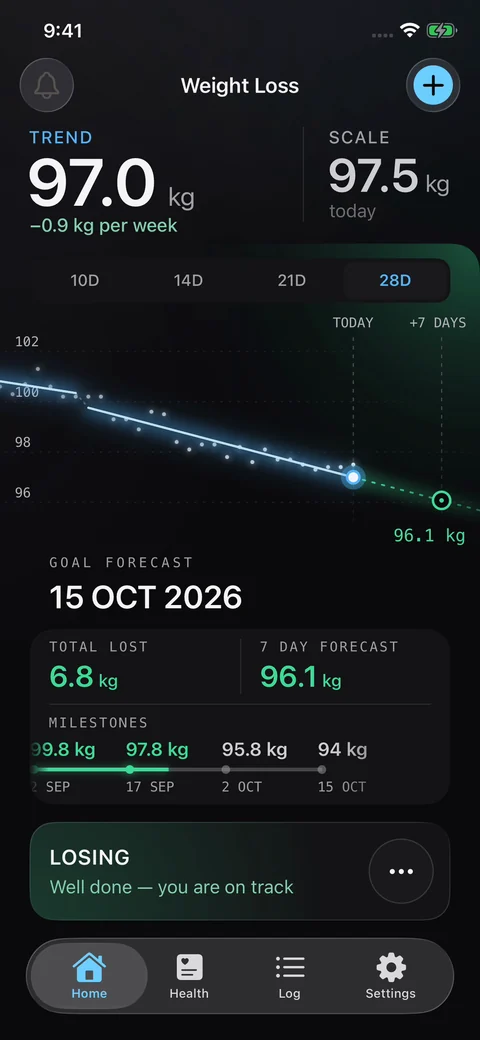
The main trend gives you the longer view. The warning line pays closer attention to the recent readings, looking for a possible turn.
In this screenshot, the main blue trend still slopes down. The short amber line turns up, and the app shows a gain signal. The recent readings are beginning to tell a different story.
This is the next part of the feedback loop: notice the change, reflect on your routine and decide how to respond. Then see how the pattern develops with your next weigh-ins.
A warning is a prompt to review. It does not prove a change in body fat or tell you to eat less or exercise more.
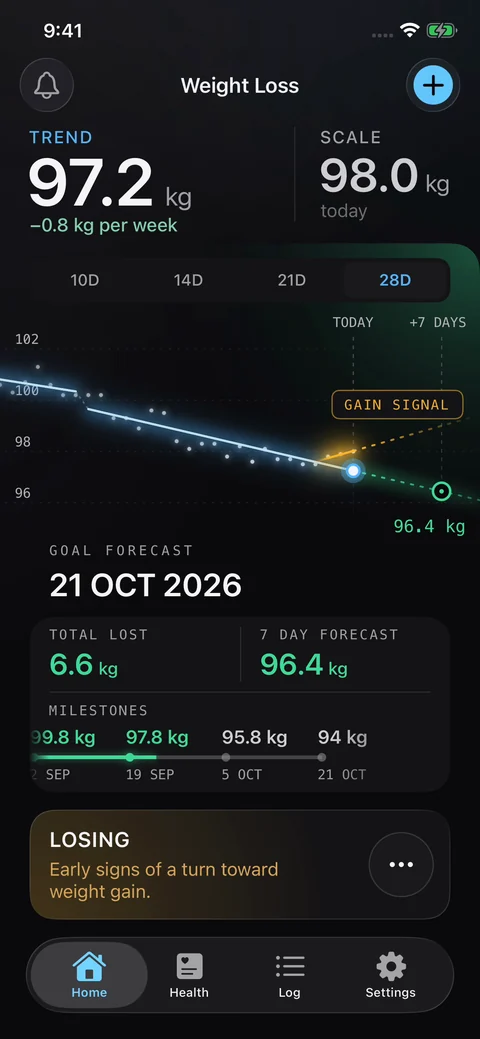
Once you reach your goal, you can switch to maintenance. Instead of following a losing or gaining trend, the app looks for stretches of readings with a similar weight level.
The points still vary each day. Each flat section summarises a usual level; a vertical step marks a detected change. In this example, the level moves down into the shaded target range and then settles at a lower level.
The dashed boundaries show the chosen limits. You can see where the level sits within them, rather than treating every change on the scale as a new direction.
The feedback changes with your goal: keep your usual weight within a range, rather than keep chasing a lower number.
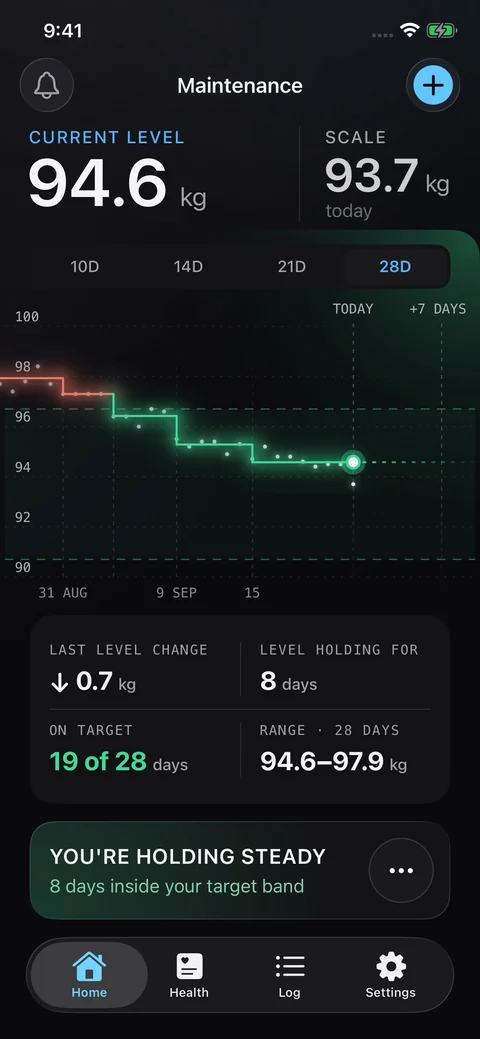
These answer different questions. Standard shows moving averages; True Progress Pro adds advanced change detection to your imported Apple Health data.
A moving average combines recent readings into a value that updates as new readings arrive. It softens daily ups and downs, but can still fluctuate as readings enter and leave the calculation.
Pro looks for changes in the usual level among the scattered readings. Flat sections show those levels; steps mark detected shifts, including changes that stay within your limits.
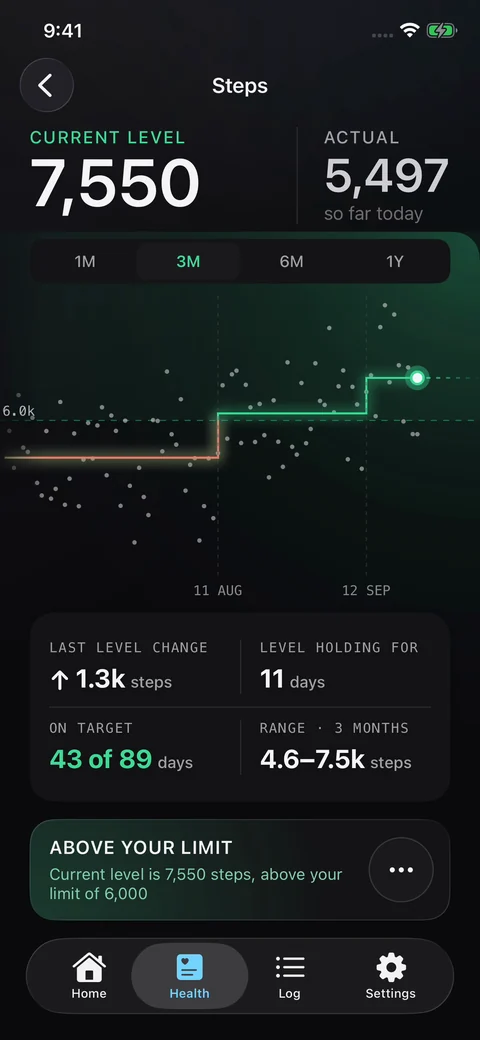
These are separate sample records, not a comparison using identical data. Weight-loss trend analysis and maintenance change detection are already included in Standard.
Follow your routine, look at the pattern and choose whether to adjust or stay the course. Your next readings bring fresh feedback. That is the loop: useful information for your next decision, without reacting to every rise and fall.
Consistent weighing conditions make comparisons more useful. A watch that was off can leave incomplete activity or sleep records. The app can show the recorded pattern, but cannot recover missing readings or establish what caused a change.
For blood pressure and other medical concerns, discuss the readings with a health professional. You can preview, share or print a PDF report from the app.